Scaling and Performance Guide
Understanding Pod
Pods serve as the smallest unit of compute that can be defined, deployed, and managed within the OpenShift Container Platform (OCP). The OCP utilizes the Kubernetes concept of a pod, which consists of one or more containers deployed together on a single host.
Pods are essentially the building blocks of a Kubernetes cluster, analogous to a machine instance (either physical or virtual) for a container. Each pod is assigned its own internal IP address, granting it complete ownership over its port space. Additionally, containers within a pod can share local storage and network resources.
The lifecycle of a pod typically involves several stages: first, the pod is defined; then, it is scheduled to run on a node within the cluster; finally, it runs until its container(s) exit or until it is removed due to some other circumstance. Depending on the cluster's policy and the exit code of its containers, pods may be removed after exiting, or they may be retained to allow access to their container logs.
Example pod configurations
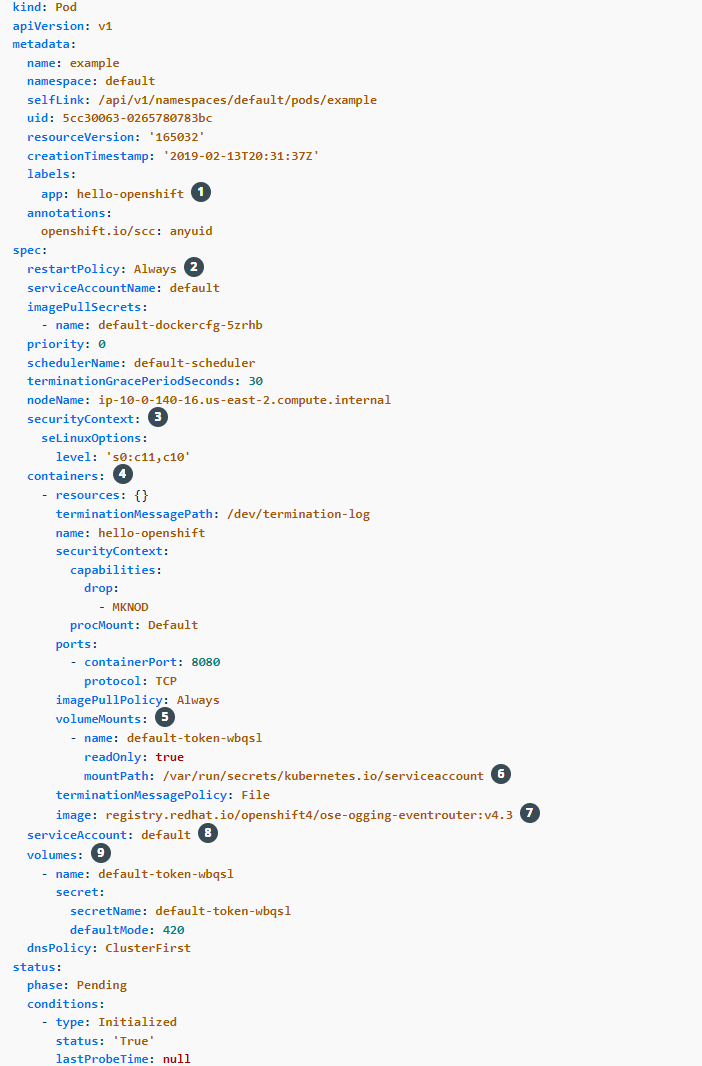
The following is an example definition of a pod from a Rails application. It demonstrates many features of pods, most of which are discussed in other topics and thus only briefly mentioned here:
-
Pods can be "tagged" with one or more labels, which can then be used to select and manage groups of pods in a single operation. The labels are stored in key/value format in the
metadatahash. -
The pod restart policy with possible values
Always,OnFailure, andNever. The default value isAlways. Read this to learn about "Configuring how pods behave after restart". -
OpenShift Container Platform defines a security context for containers which specifies whether they are allowed to run as privileged containers, run as a user of their choice, and more. The default context is very restrictive but administrators can modify this as needed.
-
containersspecifies an array of one or more container definitions. -
The container specifies where external storage volumes are mounted within the container. In this case, there is a volume for storing access to credentials the registry needs for making requests against the OpenShift Container Platform API.
-
Specify the volumes to provide for the pod. Volumes mount at the specified path. Do not mount to the container root,
/, or any path that is the same in the host and the container. This can corrupt your host system if the container is sufficiently privileged, such as the host/dev/ptsfiles. It is safe to mount the host by using/host. -
Each container in the pod is instantiated from its own container image.
Rate Limits While Pulling Container Image
By default, Container Images are pulled from Registry i.e. Docker Hub or other commercial and private registries, which enforce rate limits on anonymous users. If your setup involves frequent image pulls, you may face these restrictions.
You need to create a Secret and link it to your Service Account or include it within the
spec.imagePullSecrets, as explained in this document, which provides instructions on how to resolve the rate limit issue while pulling container images. -
Pods making requests against the OpenShift Container Platform API is a common enough pattern that there is a
serviceAccountfield for specifying which service account user the pod should authenticate as when making the requests. This enables fine-grained access control for custom infrastructure components. -
The pod defines storage volumes that are available to its container(s) to use. In this case, it provides an ephemeral volume for a secret volume containing the default service account tokens. If you attach persistent volumes that have high file counts to pods, those pods can fail or can take a long time to start.
Viewing pods
You can refer to this user guide on how to view all pods, their usage statics (i.e. CPU, memory, and storage consumption) and logs in your project using the OpenShift CLI (oc) commands.
Compute Resources
Containers run inside pods, and every container consumes compute resources. Each container running on a node consumes compute resources, which are measurable quantities that can be requested, allocated, and consumed.
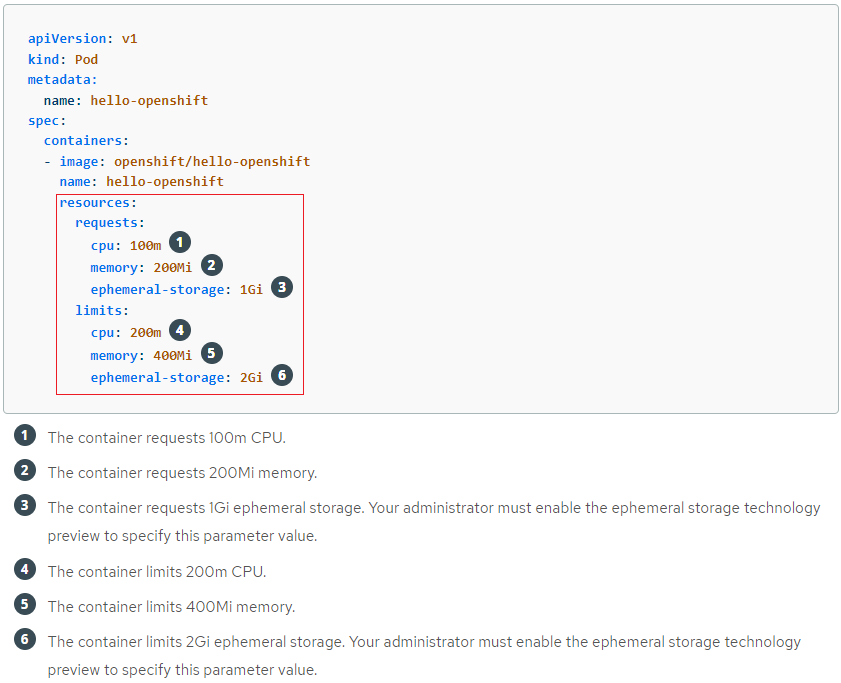
When authoring a pod configuration YAML file, you can optionally specify how much CPU, memory (RAM), and local ephemeral storage each container needs in order to better schedule pods in the cluster and ensure satisfactory performance as shown below:
How to Define CPU and Memory?
CPU, Memory, and Ephemeral Storage Units Explained
CPU is measured in units called millicores, where 1000 millicores ("m") = 1 vCPU or 1 Core. Each node in a cluster inspects the operating system to determine the amount of CPU cores on the node, then multiplies that value by 1000 to express its total capacity. For example, if a node has 2 cores, the node's CPU capacity would be represented as 2000m. If you wanted to use 1/10 of a single core, it would be represented as 100m.
Memory and ephemeral storage are measured in bytes. In addition, it may be used with SI suffixes (E, P, T, G, M, K) or their power-of-two-equivalents (Ei, Pi, Ti, Gi, Mi, Ki).
CPU and memory can be specified in a couple of ways:
Resource requests and limits are optional parameters specified at the container level. OpenShift computes a Pod's request and limit as the sum of requests and limits across all of its containers. OpenShift then uses these parameters for scheduling and resource allocation decisions.
-
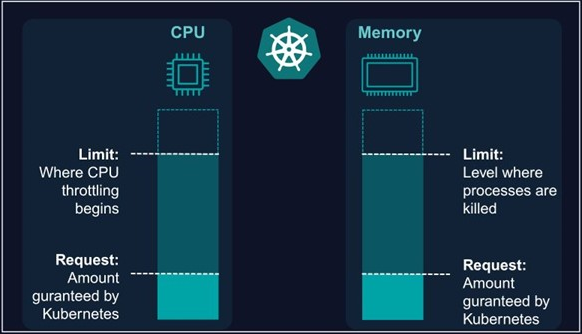
The request value specifies the minimum resource the container is guaranteed. The request value is also used by the scheduler to assign pods to nodes during scheduling.
Pods will get the amount of memory they request. If they exceed their memory request, they could be killed if another pod happens to need this memory. Pods are only ever killed when using less memory than requested if critical system or high priority workloads need the memory utilization.
Likewise, each container within a Pod is granted the CPU resources it requests, subject to availability. Additional CPU cycles may be allocated if resources are available and not required by other active Pods/Jobs.
Important Information
If a Pod's total requests are not available on a single node, then the Pod will remain in a Pending state (i.e. not running) until these resources become available.
-
The limit value specifies the upper cap. A container cannot exceed this. Limit is the value applications should be tuned to use. Pods will be memory, CPU throttled when they exceed their available memory and CPU limit.
What happens if I did not specify the Compute Resources on Pod YAML?
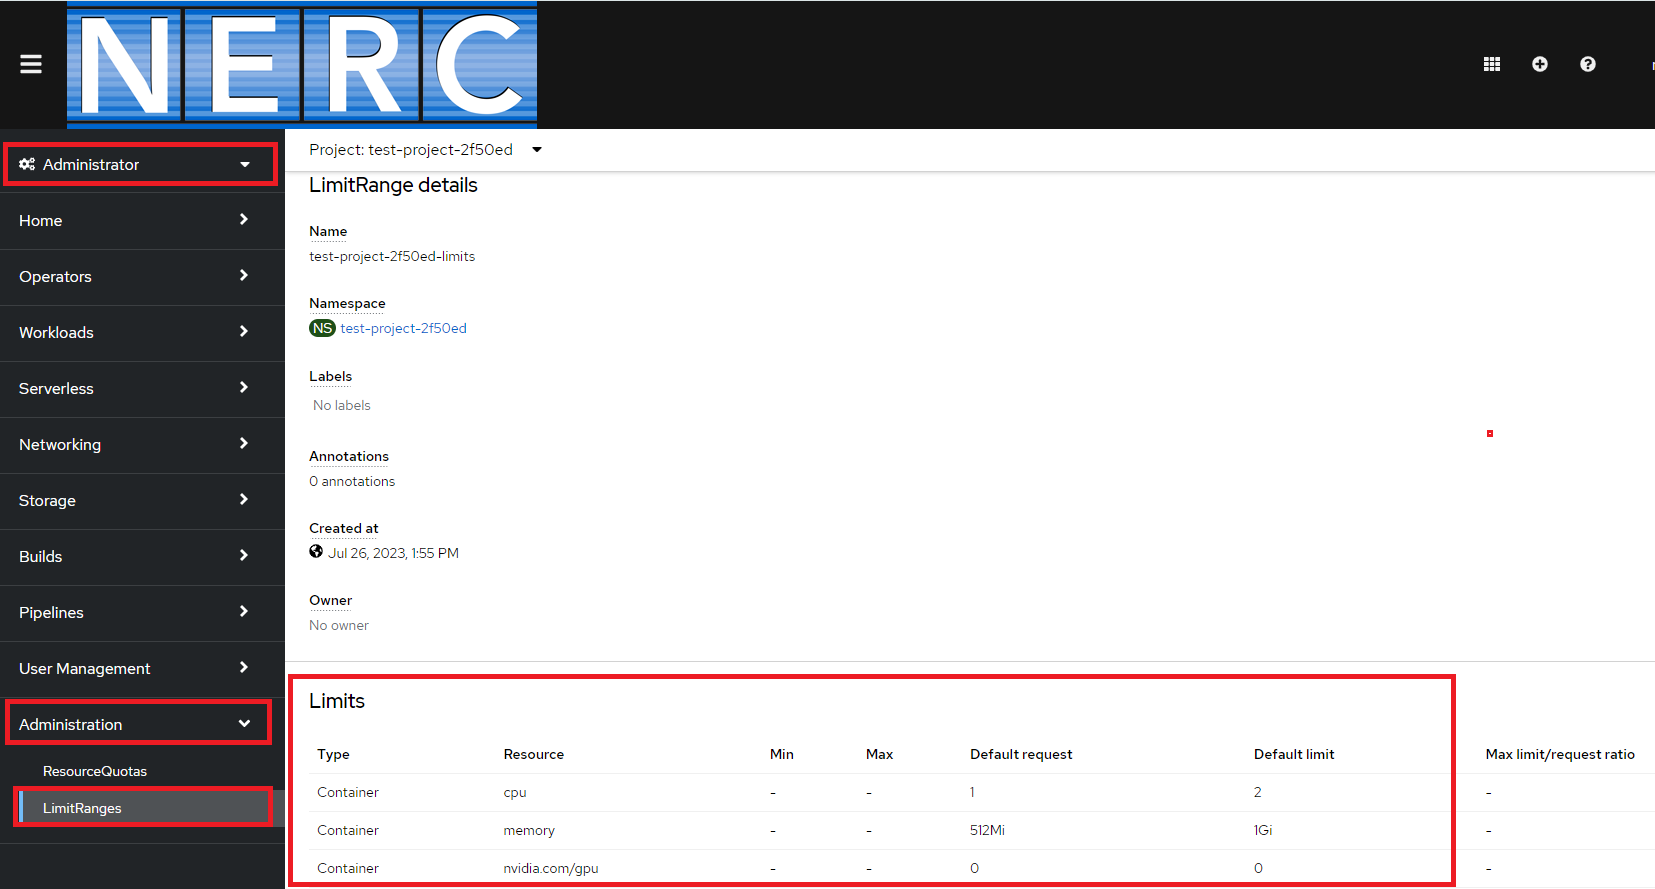
If you don't specify the compute resources for your objects i.e. containers, to restrict them from running with unbounded compute resources from our cluster the objects will use the limit ranges specified for your project namespace. With limit ranges, we restrict resource consumption for specific objects in a project. You can also be able to view the current limit range for your project by going into the Administration -> LimitRange menu as shown below:
Updating Compute Resources of a Running Pod via Resource Limits
Tips
Changing CPU/Memory requests affects scheduling and also the HPA's CPU% target math.
Keep limits ≥ requests; memory usage above the limit can trigger OOM kills.
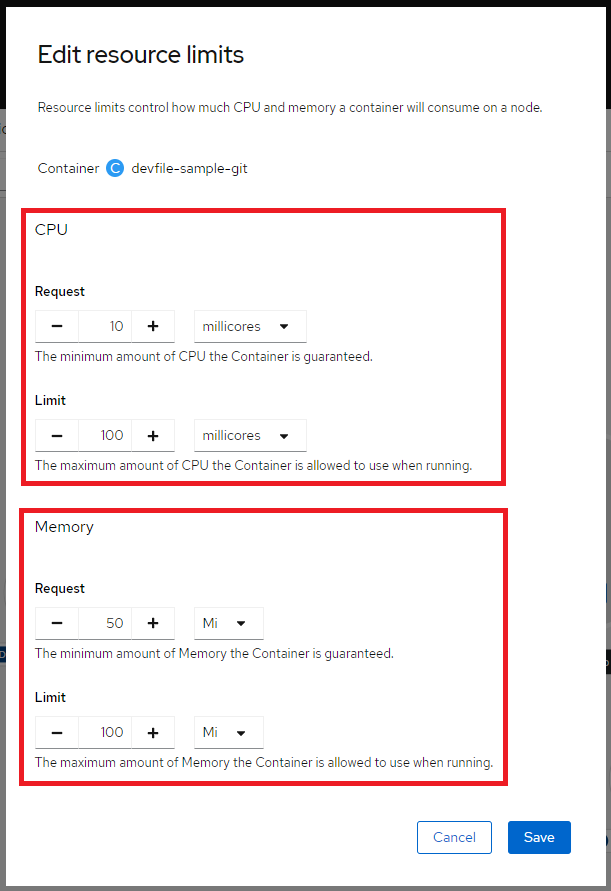
Resource limits control how much CPU and memory a container will consume on a node. You can specify a limit on how much memory and CPU a container can consume in both request and limit values. You can also specify the min request and max limit of a given container as well as the max ratio between request and limit.
Using NERC OCP Web Console
We can easily configure and modify the Resource Limit by right-click the application to see the edit options available as shown below:
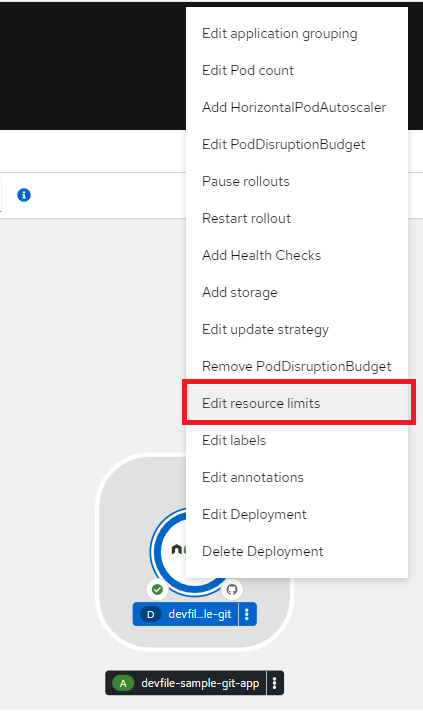
Then selecting the Edit resource limits link to set the amount of CPU and Memory resources a container is guaranteed or allowed to use when running. In the pod specifications, you must specify the resource requests, such as CPU and memory as described here.
The HPA uses this specification to determine the resource utilization and then scales the target up or down. Utilization values are calculated as a percentage of the resource requests of each pod. Missing resource request values can affect the optimal performance of the HPA.
Using oc CLI command
You can also update the Pod template in the controller (Deployment/StatefulSet/DaemonSet) using YAML and roll out new pods with the new limits/requests.
Handy checks / rollback
To See current resources for container "app" by running:
To Roll back if needed:
Update a Deployment (recommended)
Edit your Deployment YAML to set resources on each container, then oc apply -f <file>.yaml.
apiVersion: apps/v1
kind: Deployment
metadata:
  name: my-app
spec:
  replicas: 3
  selector:
    matchLabels: { app: my-app }
  template:
    metadata:
      labels: { app: my-app }
    spec:
      containers:
        - name: app
          image: your-registry/your-image:tag
          # ⬇️ Update these
          resources:
            requests:
              cpu: "250m"
              memory: "256Mi"
            limits:
              cpu: "1"        # 1 vCPU
              memory: "512Mi"
After you apply the changes, OpenShift performs a rolling update: old pods are terminated and new pods start with the updated resources. To verify the rollout, run oc rollout status deploy/my-app (replace my-app with the value of metadata.name in your Deployment).
Patch the Deployment (no file needed)
-
Using Strategic-merge patch (by container name):
-
Using JSON Patch (replace
resourceson first container):
One-liner helper
oc set resources deployment/my-app \
  --containers=app \
  --requests=cpu=250m,memory=256Mi \
  --limits=cpu=1,memory=512Mi
oc rollout status deploy/my-app
Standalone Pod (not controlled by a Deployment)
Pods are mostly immutable. To change resources, recreate the Pod with the new values:
apiVersion: v1
kind: Pod
metadata:
  name: my-pod
spec:
  containers:
    - name: app
      image: your-registry/your-image:tag
      resources:
        requests:
          cpu: "250m"
          memory: "256Mi"
        limits:
          cpu: "1"
          memory: "512Mi"
Note: Delete the old pod and create the new one (same name if desired).
Very Important Information on Using oc patch
We can use oc patch command on the controller's Pod template (Deployment/StatefulSet/DaemonSet). That triggers a rolling update with the new requests/limits. Policies like LimitRange/ResourceQuota can block higher values. If you use an HPA, remember its CPU target is based on requests, so keep those set appropriately. But we can't patch a standalone Pod's container resources; we can recreate it instead as explained here.
We can also remove limits using JSON Patch by running:
How to specify pod to use GPU?
So from a Topology view, the only thing you have to worry about is asking for GPU resources when defining your pods, with something like the following for requesting (NVIDIA A100 GPU):
spec:
  containers:
  - name: <Your Pod Name>
    image: <Your GPU Enabled Container Image>
    resources:
      requests:
        ...
        nvidia.com/gpu: <Number Of GPUs>
      limits:
        ...
        nvidia.com/gpu: <Number Of GPUs>
  tolerations:
    - key: nvidia.com/gpu.product
      operator: Equal
      value: <GPU Type>
      effect: NoSchedule
  nodeSelector:
    nvidia.com/gpu.product: <GPU Type>
GPU Resource Spec: resources, tolerations & nodeSelector
When requesting GPU resources directly from pods and deployments, you must include the spec.tolerations and spec.nodeSelector shown above, for your desired GPU type. Also, the spec.containers.resources.requests and spec.containers.resources.limits needs to include the nvidia.com/gpu specification that indicates the number of GPUs you want in your container.
In the sample Pod Spec above, you can allocate GPUs to containers by specifying the GPU resource nvidia.com/gpu and indicating the desired number of GPUs. This number should not exceed the GPU quota specified by the value of the "OpenShift Request on GPU Quota" attribute that has been approved for your "NERC-OCP (OpenShift)" resource allocation on NERC's ColdFront as described here.
ColdFront OpenShift GPU Resource Quota
There is no quota attribute to specify a desired GPU type. You can only specify the number of GPUs required per allocation (OpenShift Project) by setting the value in the "OpenShift Request on GPU Quota" attribute.
If you need to increase the quota value for the total GPUs available on your OpenShift allocation, you can submit an allocation quota change request as explained here.
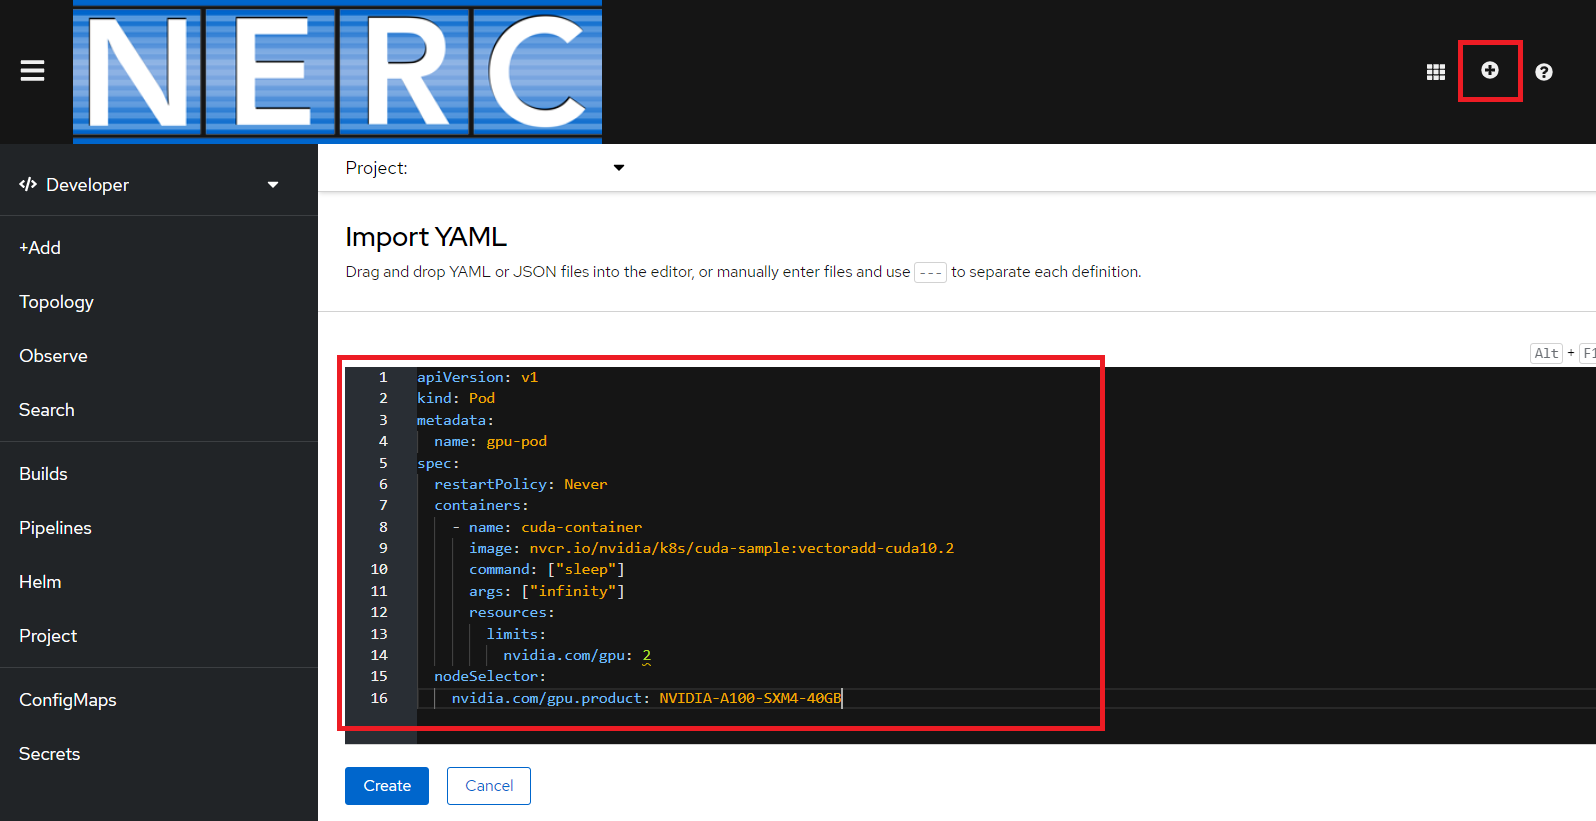
Below is an example of a running pod YAML that requests the GPU device i.e. NVIDIA-A100-SXM4-40GB with a count of 2:
apiVersion: v1
kind: Pod
metadata:
  name: gpu-pod
spec:
  restartPolicy: Never
  containers:
    - name: cuda-container
      image: nvcr.io/nvidia/k8s/cuda-sample:vectoradd-cuda10.2
      command: ["sleep"]
      args: ["infinity"]
      resources:
        limits:
          nvidia.com/gpu: 2
  tolerations:
    - key: nvidia.com/gpu.product
      operator: Equal
      value: NVIDIA-A100-SXM4-40GB
      effect: NoSchedule
  nodeSelector:
    nvidia.com/gpu.product: NVIDIA-A100-SXM4-40GB
On opened YAML editor paste the contents of the above given pod YAML as shown below:
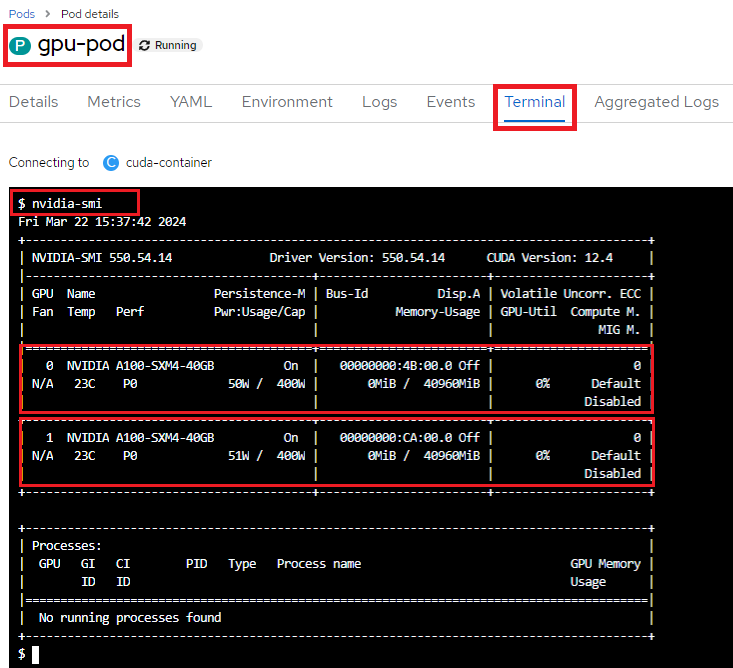
After the pod is running, navigate to the pod details and execute the following command in the Terminal to view the currently available NVIDIA GPU devices:
Additionally, you can execute the following command to narrow down and retrieve the name of the GPU device:
nvidia-smi --query-gpu=gpu_name --format=csv,noheader --id=0 | sed -e 's/ /-/g'

NVIDIA-A100-SXM4-40GB
How to select a different GPU device?
We can specify information about the GPU product type, family, count, and so on, as shown in the Pod Spec above. Also, these node labels can be used in the Pod Spec to schedule workloads based on criteria such as the GPU device name, as shown under nodeSelector to specify a different NVIDIA GPU.
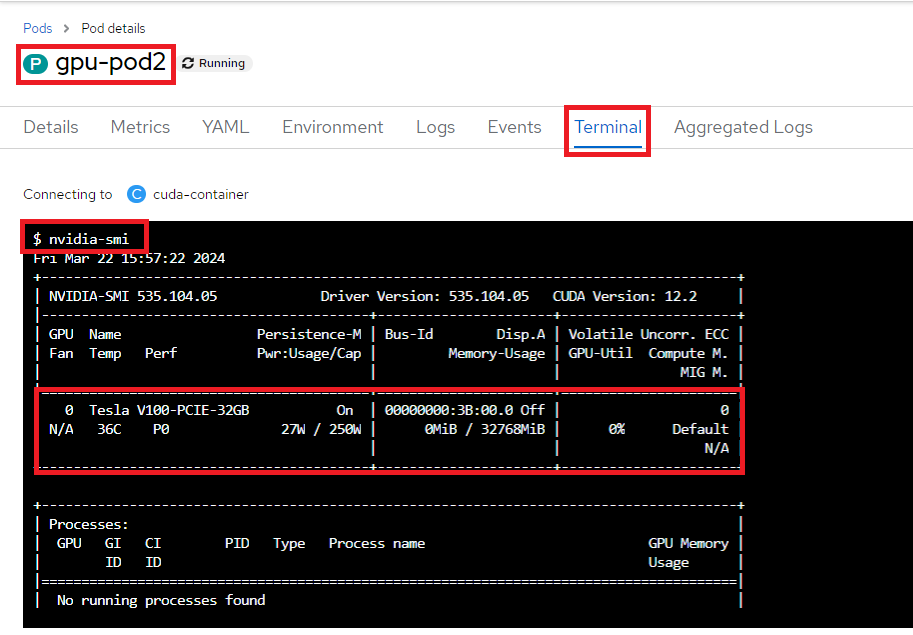
Below is an example of a running pod YAML that requests the GPU device i.e. Tesla-V100-PCIE-32GB with a count of 1:
apiVersion: v1
kind: Pod
metadata:
  name: gpu-pod2
spec:
  restartPolicy: Never
  containers:
    - name: cuda-container
      image: nvcr.io/nvidia/k8s/cuda-sample:vectoradd-cuda10.2
      command: ["sleep"]
      args: ["infinity"]
      resources:
        requests:
          memory: "64Mi"
          cpu: "250m"
          nvidia.com/gpu: 1
        limits:
          memory: "128Mi"
          cpu: "500m"
          nvidia.com/gpu: 1
  tolerations:
    - key: nvidia.com/gpu.product
      operator: Equal
      value: Tesla-V100-PCIE-32GB
      effect: NoSchedule
  nodeSelector:
    nvidia.com/gpu.product: Tesla-V100-PCIE-32GB
When you run the nvidia-smi command in the terminal, you can observe the availability of the different V100 NVIDIA GPU device, as shown below:
Requesting an H100 GPU in a Pod Specification
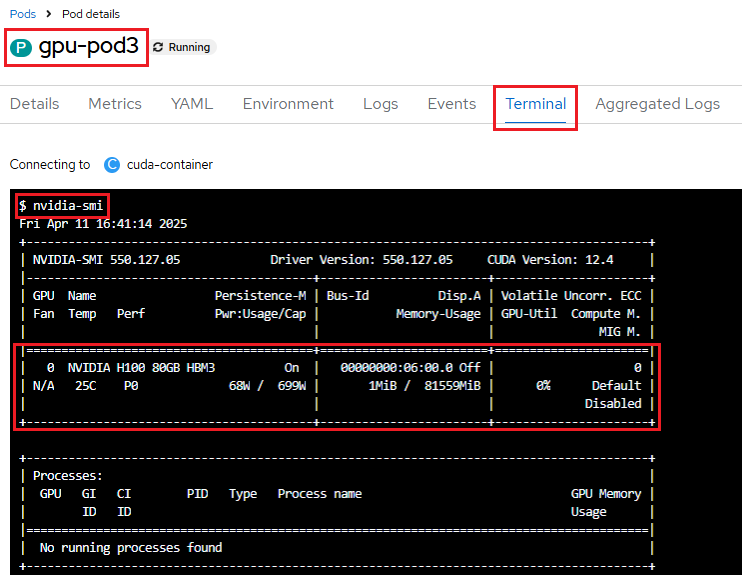
Below is an example of a running pod YAML that requests the GPU device NVIDIA-H100-80GB-HBM3 with a count of 1:
apiVersion: v1
kind: Pod
metadata:
  name: gpu-pod3
spec:
  restartPolicy: Never
  containers:
    - name: cuda-container
      image: nvcr.io/nvidia/k8s/cuda-sample:vectoradd-cuda10.2
      command: ["sleep"]
      args: ["infinity"]
      resources:
        limits:
          nvidia.com/gpu: 1
  tolerations:
    - key: nvidia.com/gpu.product
      operator: Equal
      value: NVIDIA-H100-80GB-HBM3
      effect: NoSchedule
  nodeSelector:
    nvidia.com/gpu.product: NVIDIA-H100-80GB-HBM3
When you run the nvidia-smi command in the terminal, you can observe the availability of the different H100 NVIDIA GPU device, as shown below:
Scaling
Scaling defines the number of pods or instances of the application you want to deploy. Bare pods not managed by a replication controller will not be rescheduled in the event of a node disruption. You can deploy your application using Deployment or Deployment Config objects to maintain the desired number of healthy pods and manage them from the web console. You can create deployment strategies that help reduce downtime during a change or an upgrade to the application. For more information about deployment, please read this.
Benefits of Scaling
This will allow for a quicker response to peaks in demand, and reduce costs by automatically scaling down when resources are no longer needed. This is especially useful for GPU-based resources, which are often limited and more costly.
Scaling application pods, resources and observability
The Topology view provides the details of the deployed components in the Overview panel. You can use the Details, Resources and Observe tabs to scale the application pods, check build status, services, routes, metrics, and events as follows:
Click on the component node to see the Overview panel to the right.
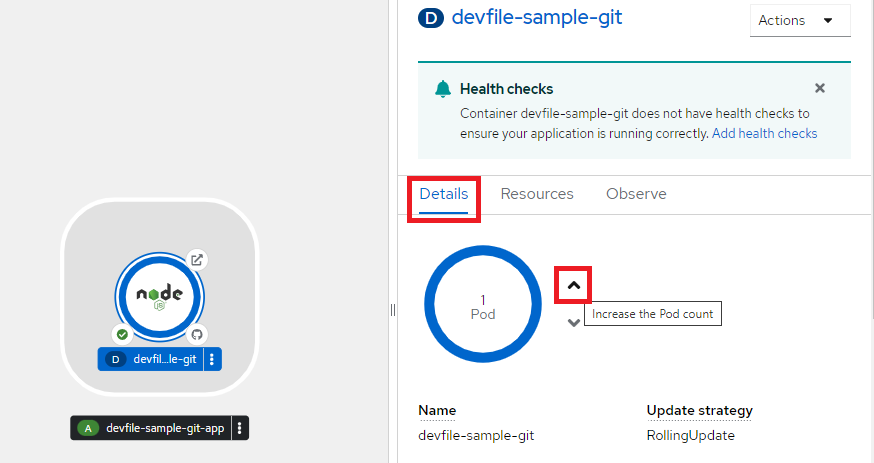
Use the Details tab to:
-
Scale your pods using the up and down arrows to increase or decrease the number of pods or instances of the application manually as shown below:
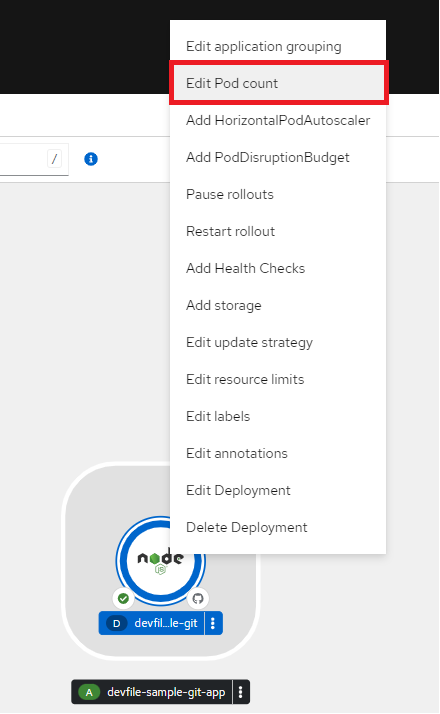
Alternatively, we can easily configure and modify the pod counts by right-click the application to see the edit options available and selecting the Edit Pod Count as shown below:
-
Check the Labels, Annotations, and Status of the application.
Click the Resources tab to:
-
See the list of all the pods, view their status, access logs, and click on the pod to see the pod details.
-
See the builds, their status, access logs, and start a new build if needed.
-
See the services and routes used by the component.
Click the Observe tab to:
-
See the metrics to see CPU usage, Memory usage and Bandwidth consumption.
-
See the Events.
Scaling manually
To manually scale a DeploymentConfig object, use the oc scale command.
oc scale dc <dc_name> --replicas=<replica_count>
For example, the following command sets the replicas in the frontend DeploymentConfig object to 3.
oc scale dc frontend --replicas=3
The number of replicas eventually propagates to the desired and current state of the deployment configured by the DeploymentConfig object frontend.
Scaling applications based on a schedule (Cron)
You can also integrate schedule based scaling uses OpenShift/Kubernetes native resources called CronJob that execute a task periodically (date + time) written in Cron format. For example, scaling an app to 5 replicas at 0900; and then scaling it down to 1 pod at 2359. To learn more about this, please refer to this blog post.
AutoScaling
We can configure automatic scaling, or autoscaling, for applications to match incoming demand. This feature automatically adjusts the scale of a replication controller or deployment configuration based on metrics collected from the pods belonging to that replication controller or deployment configuration. You can create a Horizontal Pod Autoscaler (HPA) for any deployment, deployment config, replica set, replication controller, or stateful set.
For instance, if an application receives no traffic, it is scaled down to the minimum number of replicas configured for the application. Conversely, replicas can be scaled up to meet demand if traffic to the application increases.
Understanding Horizontal Pod Autoscalers (HPA)
If your application experiences fluctuating load, you can use a Horizontal Pod Autoscaler (HPA) to specify the minimum and maximum number of pods to run, as well as the target CPU utilization or memory utilization for your pods.
Configure HPA to automatically scale your Pods based on CPU utilization and a custom metric.
| Metric | Description |
|---|---|
| CPU Utilization | Number of CPU cores used. Can be used to calculate a percentage of the pod's requested CPU. |
| Memory Utilization | Amount of memory used. Can be used to calculate a percentage of the pod's requested memory. |
After you create a HPA, OCP begins to query the CPU and/or memory resource metrics on the pods. When these metrics are available, the HPA computes the ratio of the current metric utilization with the desired metric utilization, and scales up or down accordingly. The query and scaling occurs at a regular interval, but can take one to two minutes before metrics become available.
For replication controllers, this scaling corresponds directly to the replicas of the replication controller. For deployment configurations, scaling corresponds directly to the replica count of the deployment configuration. Note that autoscaling applies only to the latest deployment in the Complete phase.
For more information on how the HPA works, read this documentation.
Very Important Note
To implement the HPA, all targeted pods must have a Resource limits set on their containers. The HPA will not have CPU and Memory metrics until Resource limits are set. CPU request and limit must be set before CPU utilization can be set. Memory request and limit must be set before Memory utilization can be set.
Creating a HPA by using the web console
From the web console, you can create a HPA that specifies the minimum and maximum number of pods you want to run on a Deployment or DeploymentConfig object. You can also define the amount of CPU or memory usage that your pods should target. The HPA increases and decreases the number of replicas between the minimum and maximum numbers to maintain the specified CPU utilization across all pods.
To create an HPA in the web console
-
In the Topology view, click the node to reveal the side pane.
-
From the Actions drop-down list, select Add HorizontalPodAutoscaler as shown below:
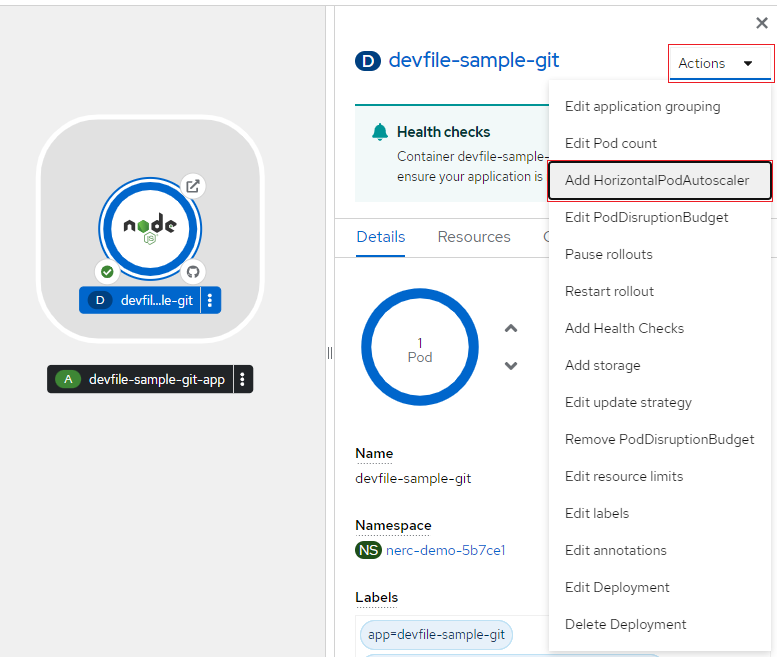
-
This will open the Add HorizontalPodAutoscaler form as shown below:
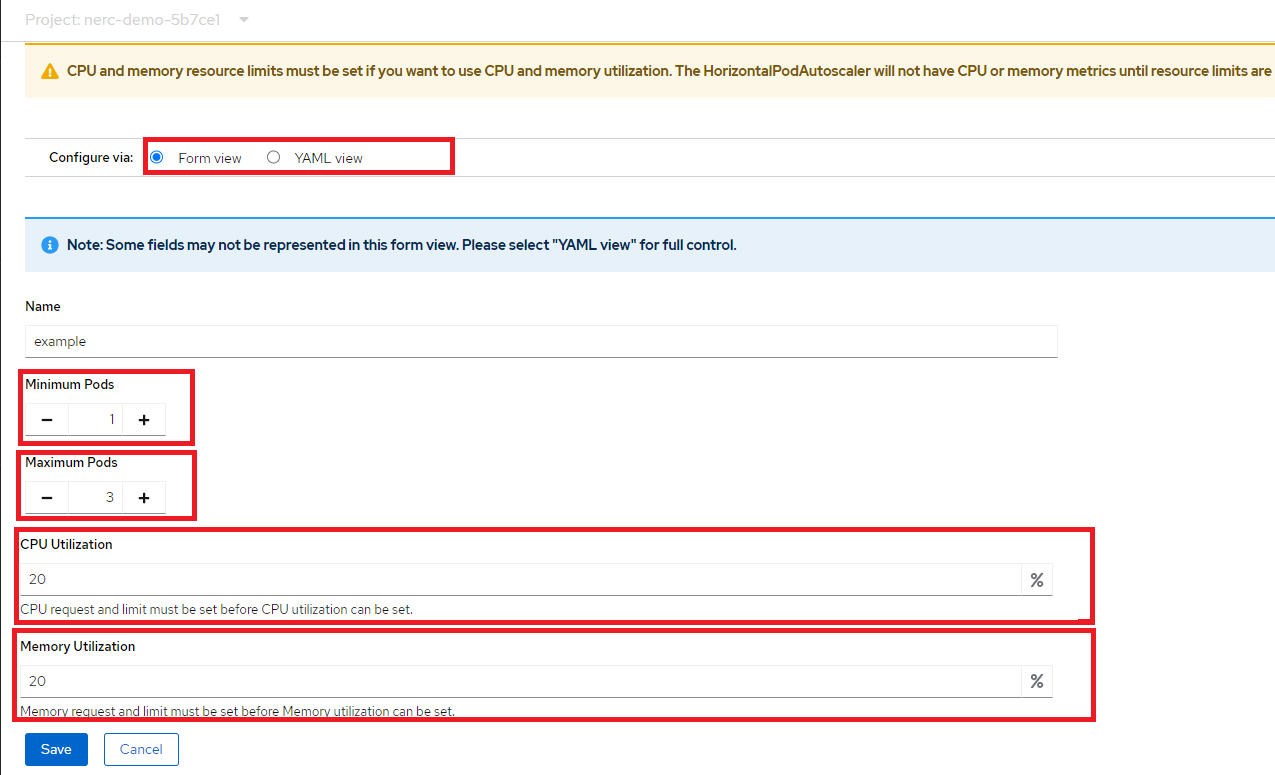
Configure via: Form or YAML View
While creating or editing the horizontal pod autoscaler in the web console, you can switch from Form view to YAML view.
-
From the Add HorizontalPodAutoscaler form, define the name, minimum and maximum pod limits, the CPU and memory usage, and click Save.
To edit an HPA in the web console
-
In the Topology view, click the node to reveal the side pane.
-
From the Actions drop-down list, select Edit HorizontalPodAutoscaler to open the Edit Horizontal Pod Autoscaler form.
-
From the Edit Horizontal Pod Autoscaler form, edit the minimum and maximum pod limits and the CPU and memory usage, and click Save.
To remove an HPA in the web console
-
In the Topology view, click the node to reveal the side panel.
-
From the Actions drop-down list, select Remove HorizontalPodAutoscaler.
-
In the confirmation pop-up window, click Remove to remove the HPA.
Best Practices
Read this document to learn more about best practices regarding Horizontal Pod Autoscaler (HPA) autoscaling.